Sales are millions of copies, rounded to the nearest million, which is the same rounding printed on the charts. The year line draws every year from 2000 to 2016. Genre and platform rows are the categories labeled on those two charts.
Sales by release year
Year
Sales (millions)
2000
202
2001
331
2002
395
2003
358
2004
419
2005
460
2006
521
2007
611
2008
679
2009
667
2010
600
2011
516
2012
364
2013
368
2014
337
2015
264
2016
71
Top genres
Genre
Sales (millions)
Action
1,723
Sports
1,309
Shooter
1,026
Role-Playing
924
Platform
829
Misc
798
Racing
727
Fighting
444
Top platforms
Platform
Sales (millions)
PS2
1,233
X360
970
PS3
949
Wii
910
DS
819
PS
727
GBA
314
PSP
290
PS4
278
PC
255
Sales rose for eight years, then fell
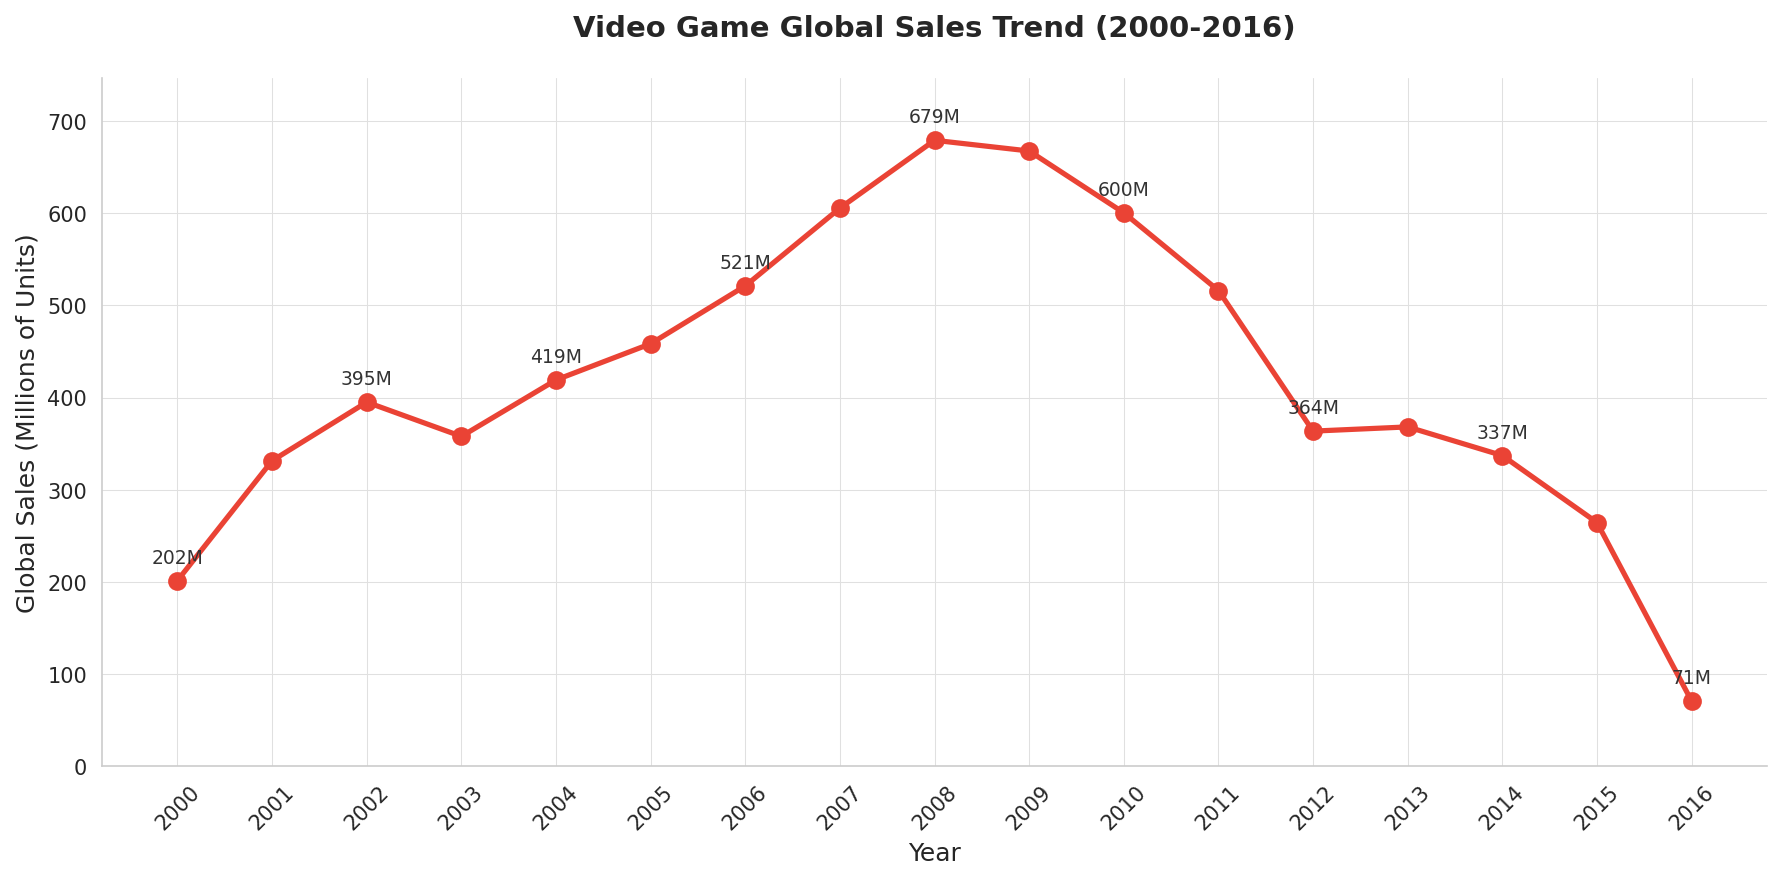
A line chart is the right shape for this cut because the question is what will happen next. The horizontal axis is time, and the vertical axis is the sale. In 2000 the table records 202 million copies. The line reaches 679 million in 2008, more than three times the 2000 total, and 2009 is still close at 667 million. After 2011 the line steps down: 364 million in 2012, 337 million in 2014, and 71 million in 2016.
The 2016 point should not be read as the year people stopped buying games, even though it is quite low relatively, there is still millions of sales. The line still shows a real change of era. The peak sits on the years when the Wii, the Xbox 360, and the PlayStation 3 were all on shelves, which is the golden age of 2008. The drop begins as that generation aged.
Action, sports, and shooters hold the top of the genre list
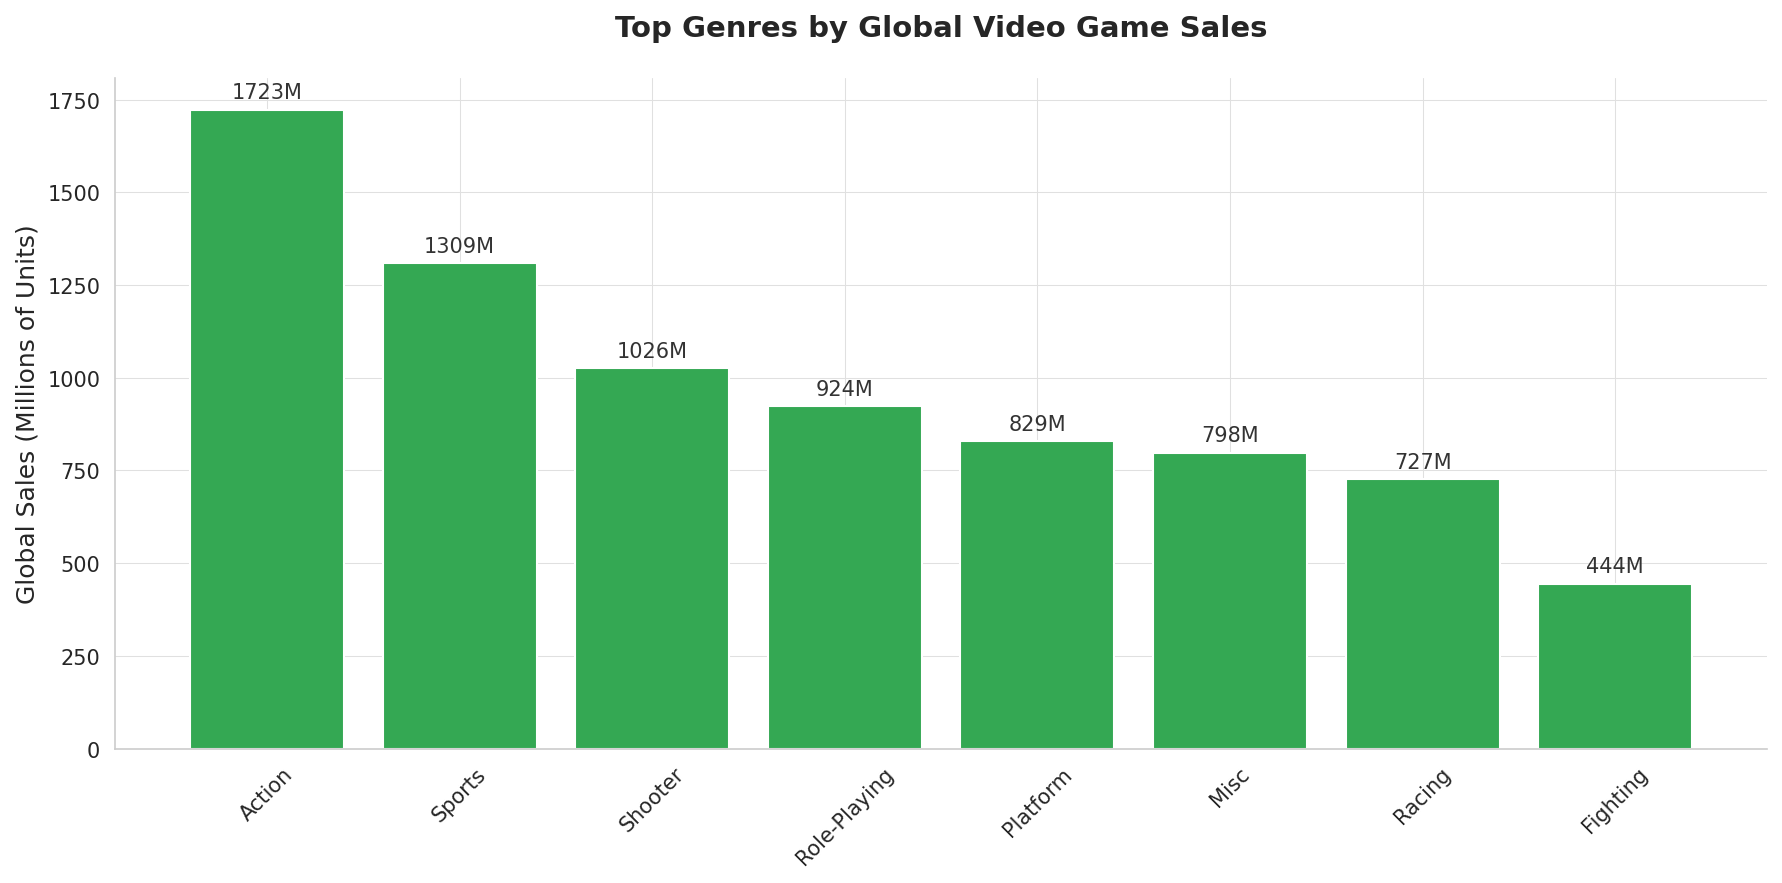
Columns share a baseline, so the ranking is the height of the bar. Sorting them from largest to smallest makes the argument without a second sentence: Action is first. The data labels sit on the bars, so the comparison does not depend on tracing a gridline.
Action accounts for 1,723 million copies. Sports is next at 1,309 million, then Shooter at 1,026 million. Those three bars sum to 4,058 million. The eight genres on the chart sum to 7,780 million, so the top three are about 52 percent of the genres drawn here.
Four older consoles still hold most of the platform total
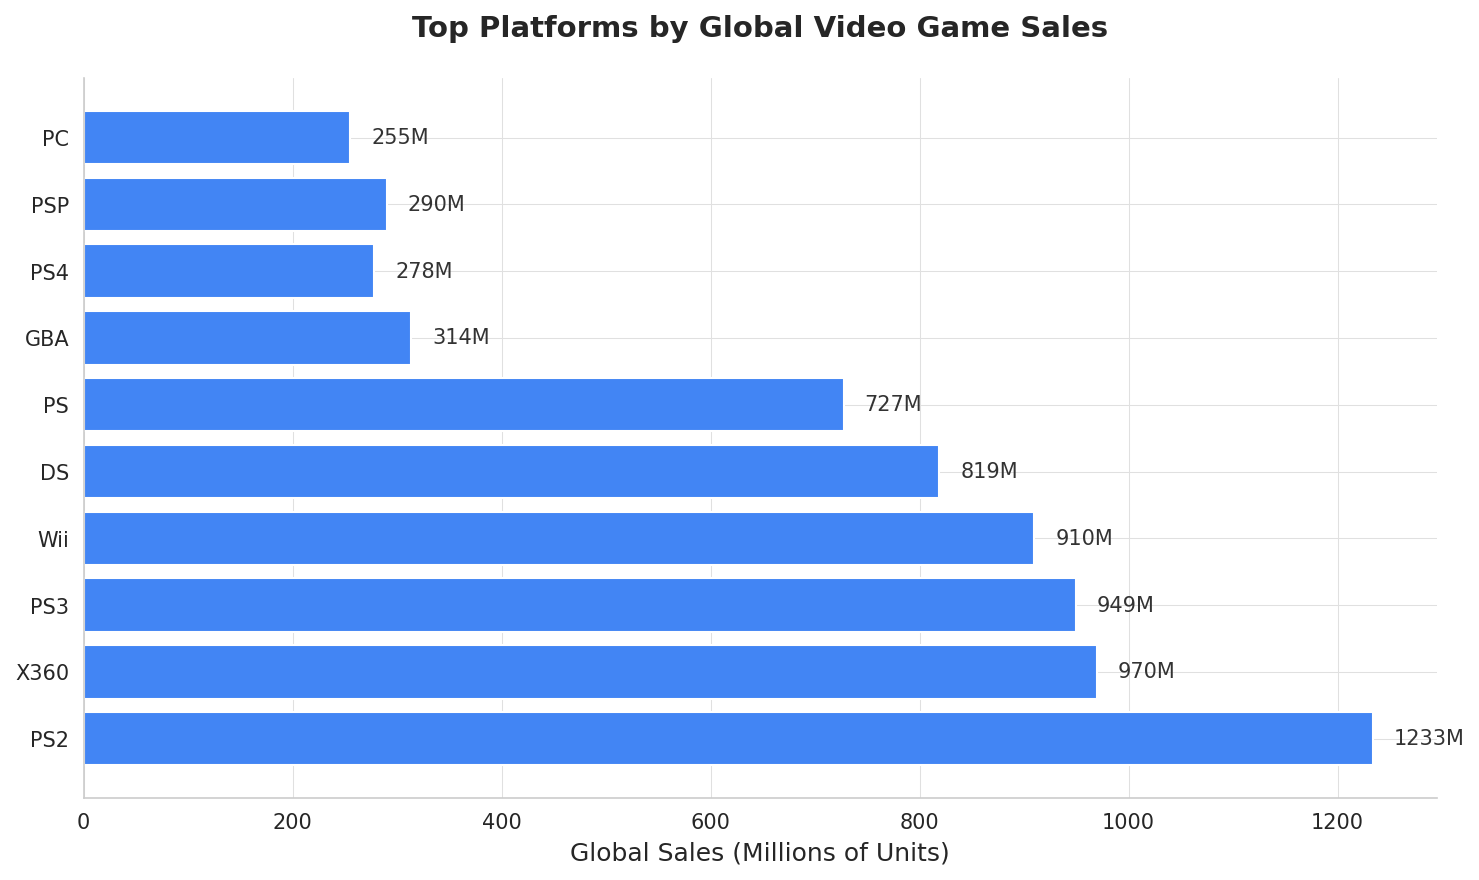
Each name sits on its own row, and the label at the end of the bar can be read without turning the category text. The longest bar is the claim.
The PlayStation 2 leads at 1,233 million copies. The Xbox 360 (970 million), PlayStation 3 (949 million), and Wii (910 million) form a tight group just behind it. Those four bars sum to 4,062 million, about 60 percent of the 6,745 million on this ten-platform chart. The PC bar, 255 million, is the shortest of the ten. In this table, a long-lived home console outruns a newer one that had fewer years on the market.